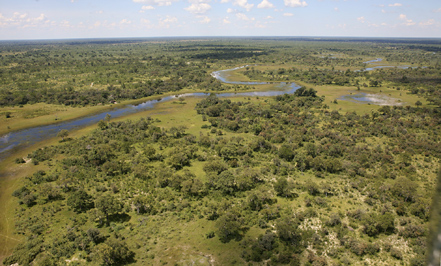
Okavango Delta Flood Update
Latest
update: April 10, 2013
Okavango
Flood update - April 10, 2013
The 2012 flood levels were the lowest in several years, and this year's flood looks even smaller, so maybe we are seeing a slight decline in what was thought to have been a long wet cycle... we shall see.
The
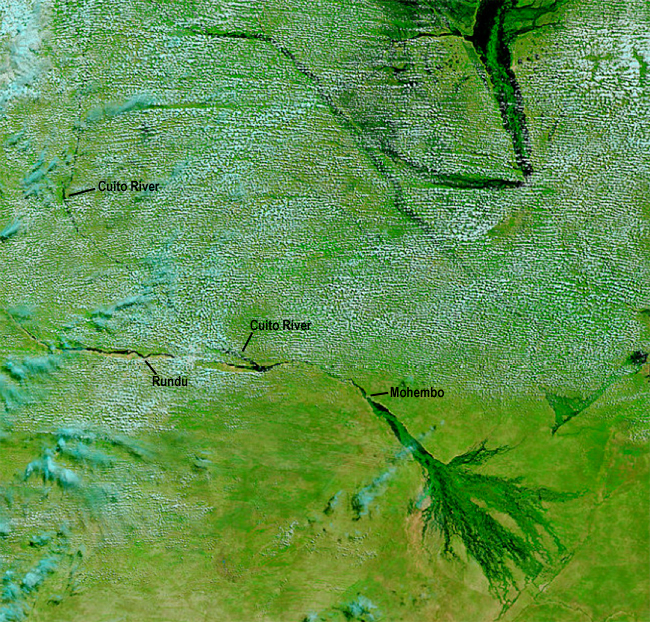
chart below shows data as of April 10, 2013...
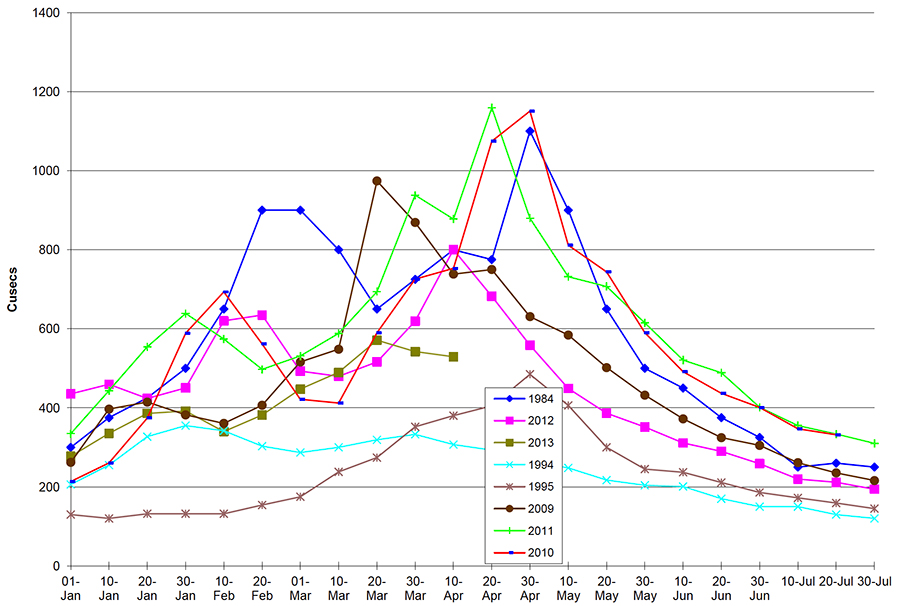
(measured in cubic
metres per second at Mohembo, on the
Okavango River just as it enters Botswana)
Prior Years Flood Highlights and Information
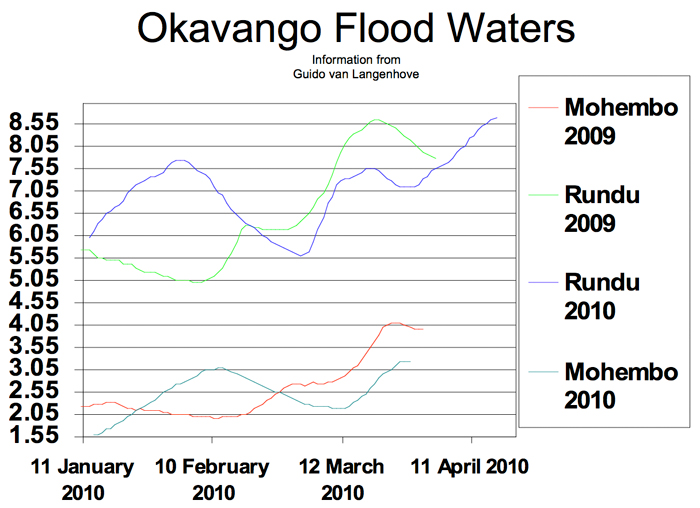
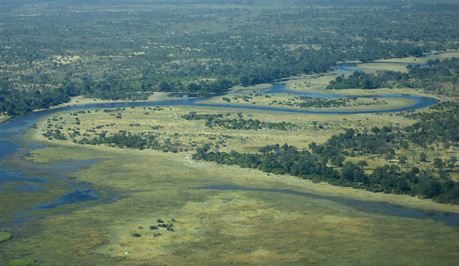
THE 2010 OKAVANGO DELTA FLOOD
By now, everybody will have been involved in conversations regarding "the super flood of 2010", which will take various forms around northern Botswana and even further afield. In an effort to explain the facts and to get everyone to understand the importance and benefits of this phenomenon, I offer some notes which have been gathered from meetings with Dr Piotr Wolski who is the associate Professor of Hydrology at the Harry Oppenheimer Okavango Research Centre (University of Botswana), Professor Spike Mc Carthy – Professor of Geosciences at the University of the Witwatersrand and from personal observations on the ground.
Professor McCarthy has been leading teams of researchers into the Okavango region for over twenty years, and has documented many of the physical and chemical structures and changes of the delta, whilst Prof. Wolski and his team have analyzed as much data as is available on the rainfall, climate and hydrology of the region.
In a nutshell, they have detected that there is a distinct cycle to the inflows and flooding patterns of the Okavango and associated river systems, over short and longer term cycles. Many factors are involved in the development of each years flooding, some of which are obvious and others more subtle. The most basic of these is the input of water which takes on several forms and which are influenced by the timing of events such as rainfall in the catchments in Angola as well as rainfall over the delta itself.
Importantly – It must be understood that the delta has a "memory," so to speak, in that the extent, size and duration of last seasons rains and floods have a major effect on that of the current season. This effect will have a cumulative reaction in that a large flood year, followed by an above average rainfall year, followed by another of that description, can lead to a "super" year such as we are having now. These "wet" years are usually in groups of between ten and fifteen years continuous, so we can expect that 2010 is about year three into a wet cycle, just as the "dry" years lasted between 1985 and 2005.
In summary – The flood of 2010 has it's beginnings in 2008 when the inflows from Angola started to become slightly above average. In that same rain season we had slightly above average rainfall. The effect of this in 2008 was that the ground water beneath the delta was recharged to the extent that the floods and rainfall of 2009 would have been translated in reasonably large inundations whatever the size of the inputs that year may have been. However, as it turns out, the floods from Angola in 2009 were above average, as were the rains, resulting in the wonderful floods of 2009.
Here we are in May 2010 and we have the perfect conditions for a beautiful flood once again. In fact, the timings are so good that the waters of 2010, within the delta fan, are going be as good as any we have seen since the 1970's. These conditions, as laid out above are:
1) The high water tables as a result of both 2008 and 2009 inputs from flood and rainfall (memory);
2) Increased inputs from the two Angolan rivers in 2010 with both the Cubango and Quito receiving good rainfall.
3) Well above average rains over the Okavango Delta Fan itself. The rainfall recorded at Maun airport exceeded 890mm for the season.
4) The floods from Angola has started arriving in the delta fan early.
5) Intense rainfall events as late as March and April over the delta, joined these flood inputs.
For many people, this is a "once in a lifetime" event, but which in fact has happened many times before in the delta and will happen again. Understanding that water is the very essence of the delta, and has had a hand in the formation of all the features and forms that we see out there, is important when [understanding] this flood. Everywhere that there is a grassland can be expected to be flooded during mid 2010, and we will see important changes in vegetation structures and the resultant movement of animal life.
All over northern Botswana the effects will be felt. Areas where game drives used to be possible will be closed for extended periods this year, and we should be looking at more use of boats and mekoro, whilst island walking and increased bird watching will be the order. I expect that several species will benefit hugely from this increased inundation, due mainly to difficult movement for predators. Sitatunga and lechwe antelope can be expected to increase as should the success of Wattled Cranes and Slaty Egrets as their preferred nesting habitats become more available. Greater areas of shallow inundation should benefit massive numbers of fish, amphibians and reptiles whilst the explosion of insect life will provide a huge food resource for large numbers of birds, other insects, small reptiles and mammals. Even larger mammals may increase in numbers. There is a strong possibility that buffalo numbers may increase throughout the delta, and they will certainly spread our into areas they have been absent from for some time. The Savute channel and along the Linyanti used to be strongholds of these animals during the last wet cycle. Elephant will become largely absent from the very central delta, but will take advantage of the increased food and water available along the edges of the Okavango, the Savute and even the areas around Boteti. These are but a tiny fraction of the benefits of this increased inundation.
The waters will be slow to drop this year, so the season will last at least until the months of September or October and even into November when one can expect large numbers of birds to concentrate on the drying floodplains and so called "fish traps". I actually expect the floodplains still to be partially full when the next rains arrive in November or December, leading to another excellent flood next year.
This is a very special occurrence, which MUST be appreciated for what it is. The Okavango Delta, the Linyanti. The Savute, Lakes Ngami and Mababe and all the connecting rivers will be flowing at their strongest with clean, life giving water, and which will bring to life, and life to, massive biodiversity over an area of over 20,000 square kilometres. You and your guests are privileged residents and visitors, so enjoy, observe and please share this amazing period in the northern Botswana region.
Map Ives
Environmental Person
Wilderness Safaris Botswana
10 May, 2010
2010
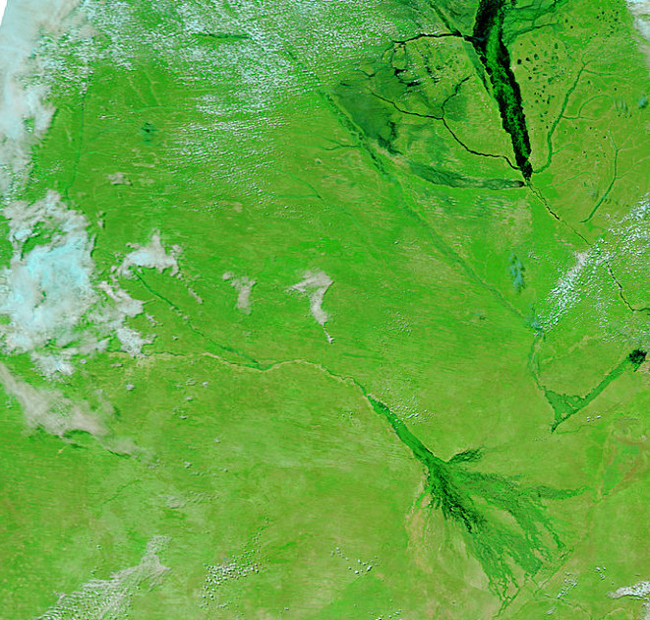
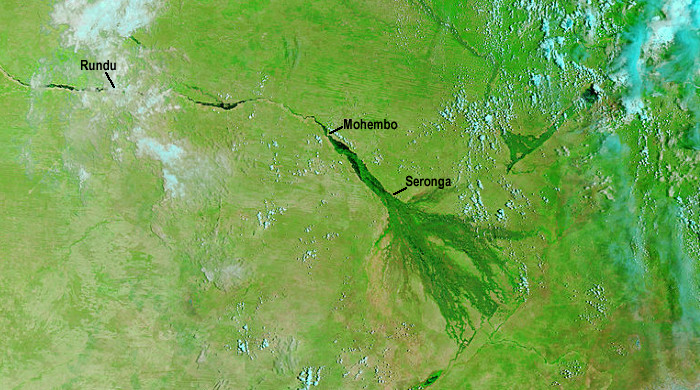
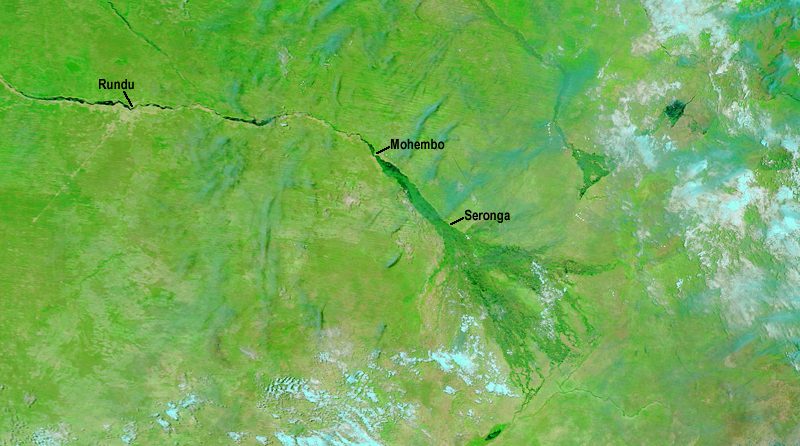
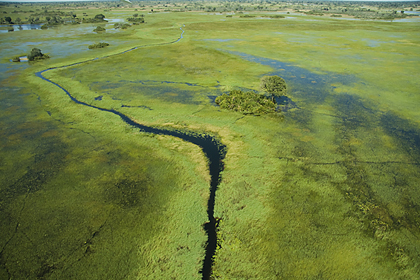
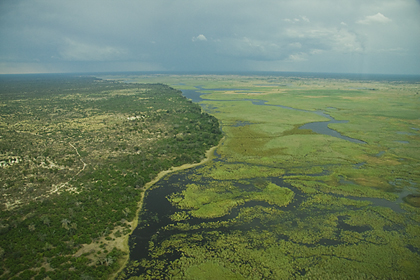
Early 2010 Satellite Images
(Current flood water shows as dark green)
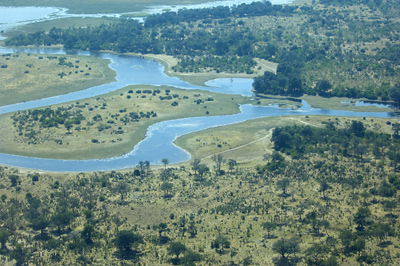
THE OKAVANGO DELTA 2009 – A MAGNIFICENT FLOOD
It is that time of year when the data is coming in thick and fast, from hydrologists throughout southern Africa regarding the state of flows in our rivers, and the environmental and social effects of those flows. This includes data from the water authorities in Namibia, Angola, Botswana and Zambia outlining the scenarios for the Kunene, Zambezi, Kwando, Kavango and Kuito rivers. (The last two combine to form the Okavango River upstream of the delta proper.)
There have a number of reports in the news media which may have created a negative impression of the "flooding", which indeed has affected a small number of people on a localized basis, but in fact has a positive effect on the ecology of the natural areas into which they flow.
Due to a combination of higher than normal Indian Ocean temperatures, low pressure centred over central Botswana and a southward movement of the moist Congo Air Boundary, the late summer rains have been well above average. This has been particularly so over the 16 Degrees South latitude in a band across the African Continent and which, fortuitously, include the catchments of some of the great rivers of south central Africa mentioned in the first paragraph. During the first two weeks of March, this band received about 120% above average rainfall, followed by localized but heavy falls along the Zambia/Angola border region as well as over the Okavango Delta itself.
All of this has resulted in river flows that are above average as measured over the last 70 years. This is not unusual in the long term, as flows such as these have been recorded before, and in fact are well placed into data sets that show a pattern of wet and dry cycles over the entire catchment area. However, in the short term, this has resulted in flows that have nor been seen in the Zambezi and Okavango Rivers since 1963.
These effects of this increased runoff on downstream environments will vary tremendously between those felt by people who have moved into low lying areas during the "dry" years, and those felt by the natural environments such as the Okavango, Savute/Chobe and Zambezian environments. Extremely high levels of water have inundated parts of the panhandle area of the Okavango, the area between the Chobe and the Zambezi, and floodplains along all these rivers. However, it must be stressed that no lives have been lost and so called flooding has only occurred in areas that have historically been floodplains. People have been assisted with evacuation to temporary shelter on higher ground nearby, where they will probably only stay for about 8 to 10 weeks before the waters subside.
Lower down the Okavango river and into the delta itself, the effects will be fantastic, as large grassland areas and floodplains which have not been inundated for many years and even decades, become flooded, and a complete recharge of groundwater takes place. Islands which have been dehydrated through no ground water flows, will now rejuvenate and distal lakes such as Ngami and Mababe will fill. These two terminal sinks along with a major increase in flows down the Boteti create wide ranging habitats for many, many waterfowl and mammal species. Linked to the Mababe lake and fed from the Linyanti/Kwando system the Savute Channel can be expected to have a major increase in flows, which may well result in the re-establishment of the famed Savute Marsh at the terminal end of the channel. The availability of so much water over a large area will have extremely beneficial effects on the distribution of the regions high elephant numbers.
Most, if not all of the camps in the Okavango are situated on islands and higher ground with many being on lifted walkways and stilts. There should be little if any, effect on the camps themselves, although some camps may have to adjust the road network somewhat since many were located during those dry years. This is in fact a natural phenomenon which only happens very occasionally in the wet and dry cycle as mentioned, and is a grand opportunity to see the rivers and deltas of the region in all their glory.
After nearly 30 years of low flows, interspersed with occasional average flows, we now have a near record inflow, the effects of which are too many to innumerate here, but suffice to say are hugely important to the biodiversity of the Okavango and the region in general.
Those of us who have lived and worked here for many years have waited for a year so special as this, come and join us, it will happen only once in a lifetime.
Map Ives
Environmental Person
Wilderness Safaris Botswana
26th March, 2009
2009
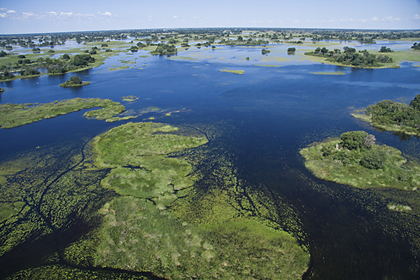
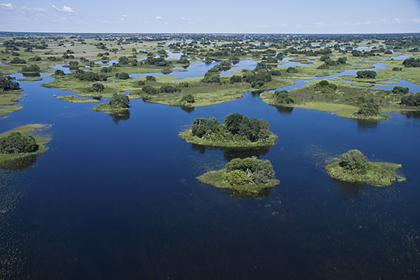
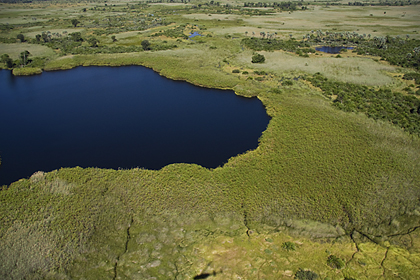
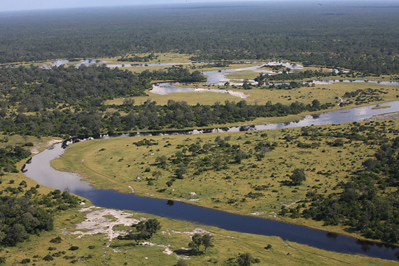
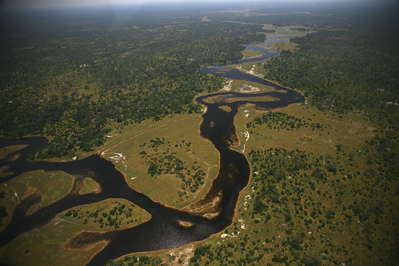
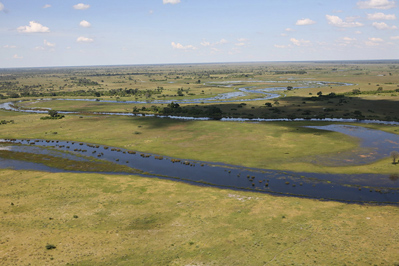
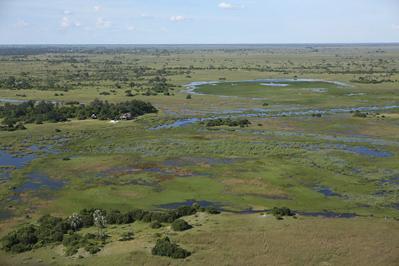
Early May 2009 Flood Images
(taken 03-06 May
2009)
Images courtesy of Grant Atkinson
2008
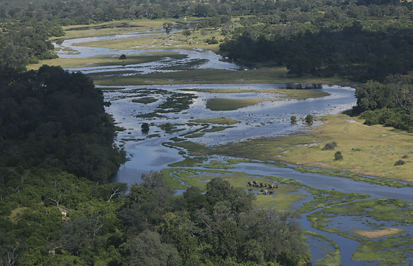
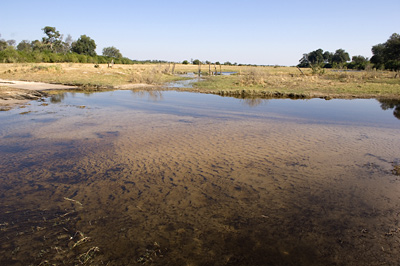
February 2008 Rain / Flood Images
(taken 15-February
2008)
Images courtesy of Colin Bell
2006
2006 Photos
of the Savuti Channel
(taken 22-June to 26-June
2006)
All images © 2006 James Weis.
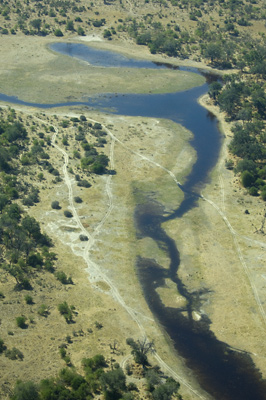
 Zibadianja Lagoon (far left)
and water flowing down the Savuti Channel
Zibadianja Lagoon (far left)
and water flowing down the Savuti Channel |
 Zibadianja Lagoon (upper left
corner) and water flowing down the Savuti
Channel
Zibadianja Lagoon (upper left
corner) and water flowing down the Savuti
Channel |
 Water in the Savuti Channel
 |
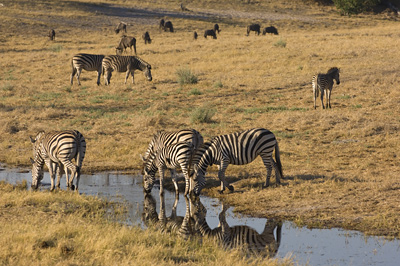 Zebras and Wildebeests -
this is over 4 kilometers down the channel
Zebras and Wildebeests -
this is over 4 kilometers down the channel |
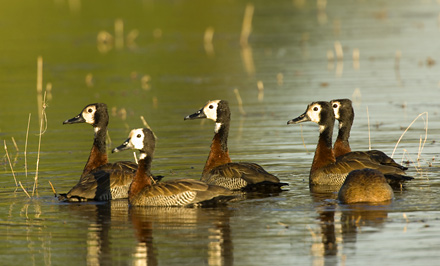 White-faced Ducks enjoying
the water in the Channel
White-faced Ducks enjoying
the water in the Channel |
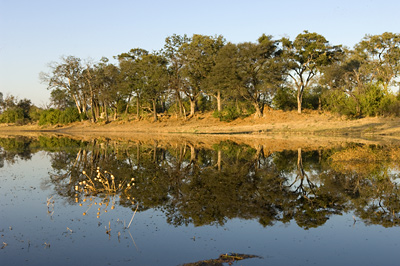 The normally dry channel
became a picturesque waterland
The normally dry channel
became a picturesque waterland |
 Water in the channel just
north of the old mopane bridge
Water in the channel just
north of the old mopane bridge |
 Top Top
|